Analyzing Perceptual Errors and Individual Accuracy
2026-02-25
Source:vignettes/errors-and-individual-accuracy.qmd
Perceptual Error Analysis
When people report how they see a social network, their perceptions systematically deviate from the true structure. The imaginarycss package classifies these deviations using two complementary tools:
-
count_recip_errors()– counts reciprocity-related misperceptions. -
count_imaginary_census()– performs the full 10-category imaginary census introduced in Tanaka & Vega Yon (2023).
Setup: A Small Example Network
We use a four-node network with one perceiver to illustrate the key ideas.
Printing the graph shows some information:
print(graph)A barry_graph with 2 networks of size 4
. . 1.00 . 1.00
1.00 . . .
. . . 1.00
. . . .
Skipping 4 rows. Skipping 4 columns. Reciprocity Errors
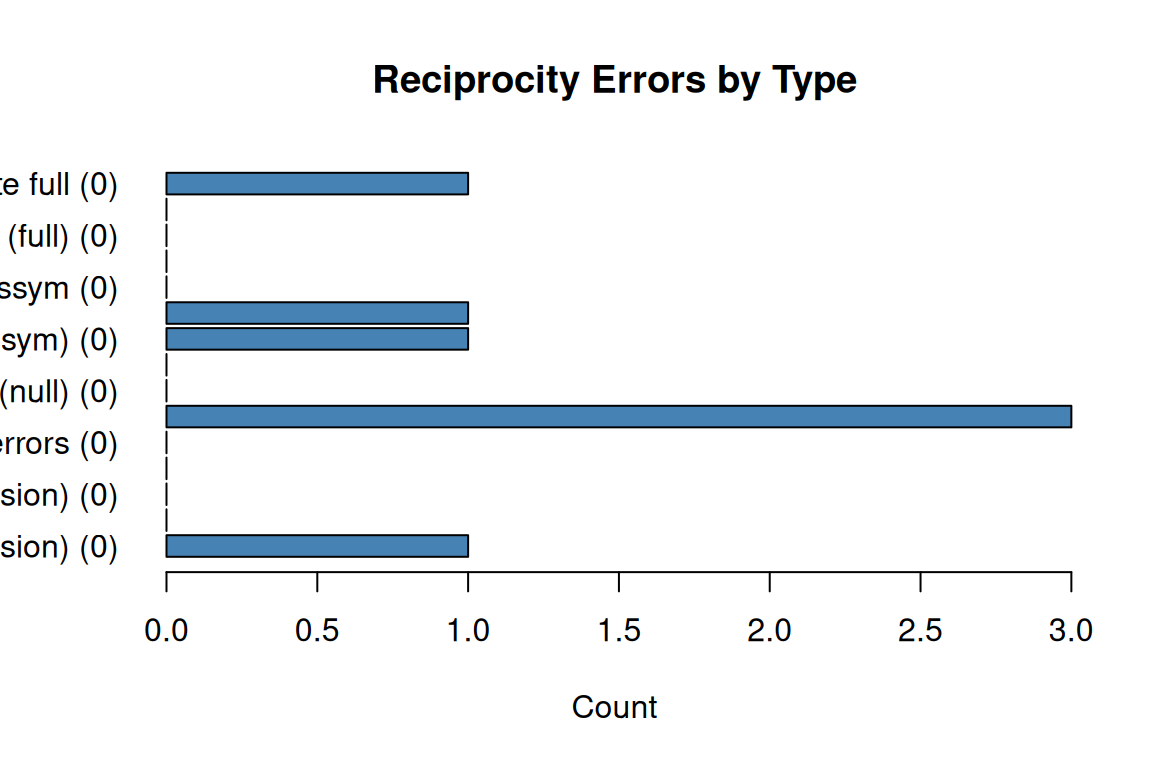
Reciprocity errors capture how often a perceiver incorrectly sees a directed tie as mutual (or vice versa). Higher counts indicate a stronger tendency to assume reciprocity where none exists.
recip_errors <- count_recip_errors(graph)
barplot(
  recip_errors$value,
  names.arg = recip_errors$name,
  horiz = TRUE, las = 1,
  col = "steelblue",
  xlab = "Count",
  main = "Reciprocity Errors by Type"
)
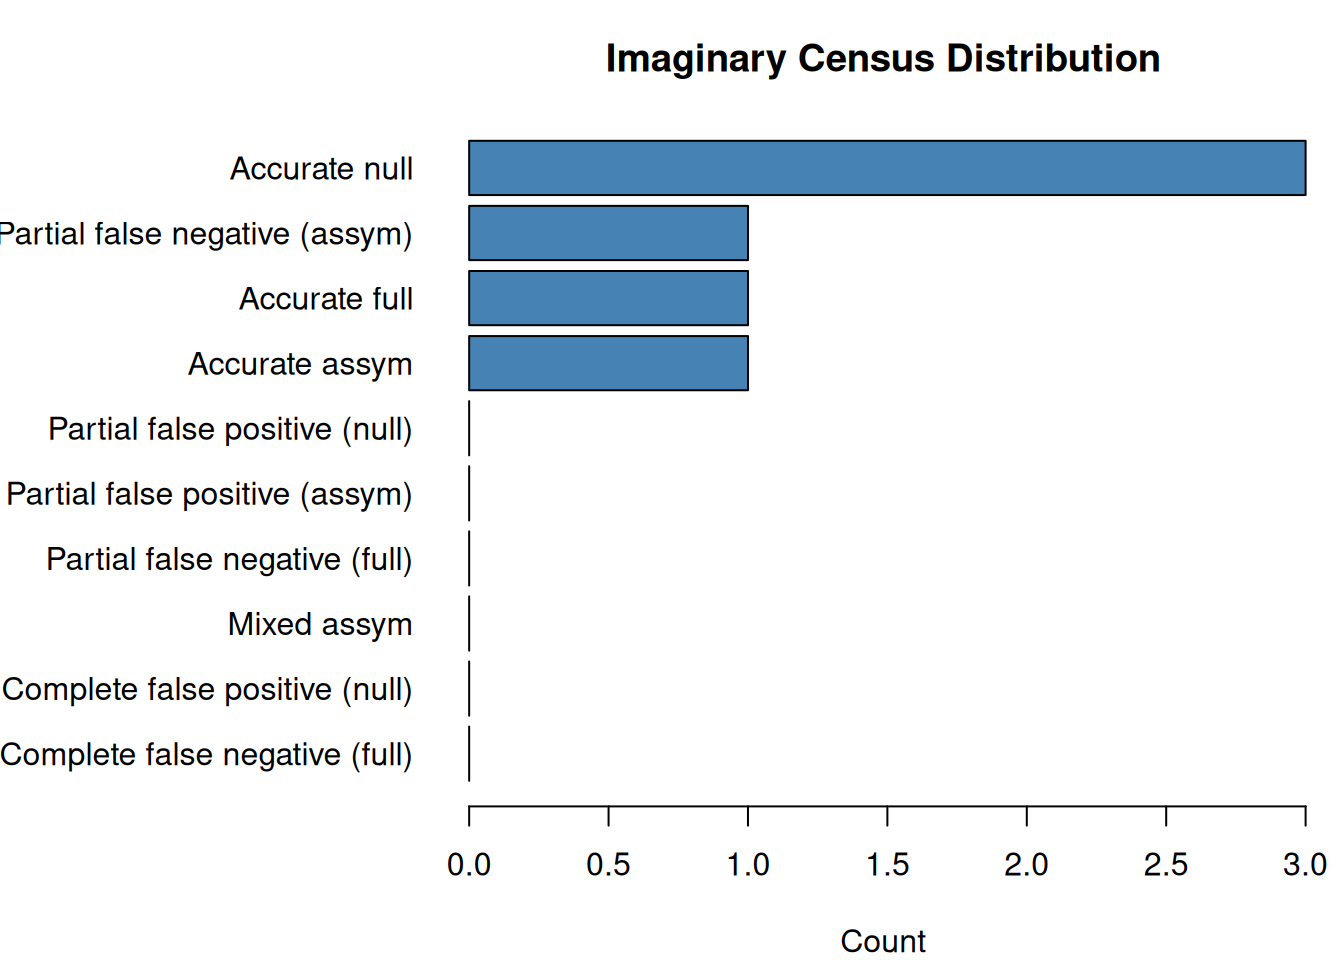
Imaginary Census
The imaginary census classifies every perceiver–dyad combination into one of ten categories that capture the full spectrum from accurate perception to complete misperception (see ?count_imaginary_census for definitions).
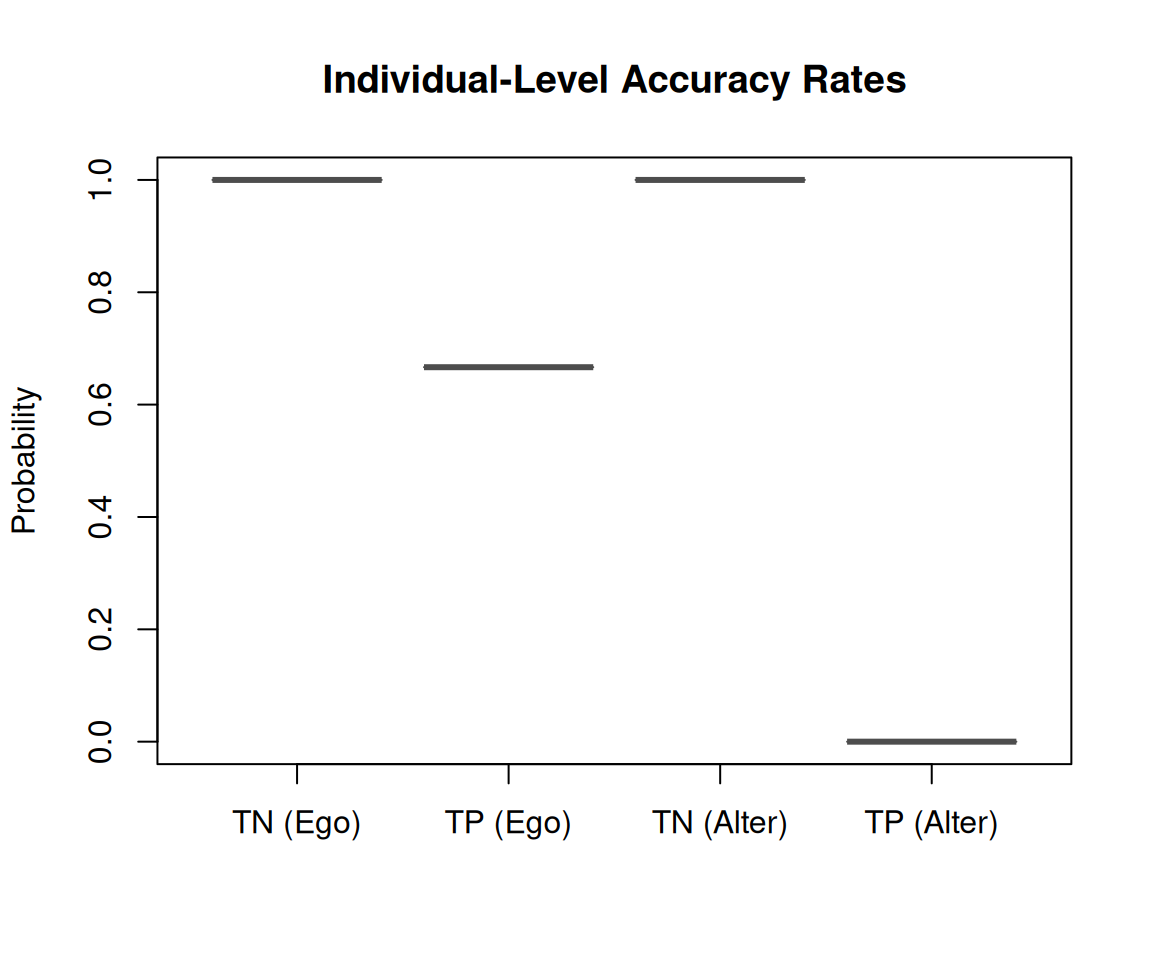
Individual Accuracy
The function tie_level_accuracy() decomposes each perceiver’s accuracy into four probabilities:
| Measure | Description |
|---|---|
p_0_ego |
P(perceive no tie | no tie exists) for ego dyads |
p_1_ego |
P(perceive tie | tie exists) for ego dyads |
p_0_alter |
P(perceive no tie | no tie exists) for alter dyads |
p_1_alter |
P(perceive tie | tie exists) for alter dyads |
These rates are then used by sample_css_network() to generate null distributions for hypothesis testing.
accuracy <- tie_level_accuracy(graph)
acc_mat <- as.matrix(accuracy[, c("p_0_ego", "p_1_ego", "p_0_alter", "p_1_alter")])

boxplot(
  acc_mat,
  names = c("TN (Ego)", "TP (Ego)", "TN (Alter)", "TP (Alter)"),
  ylab = "Probability",
  main = "Individual-Level Accuracy Rates",
  col = c("#3498db", "#2980b9", "#e74c3c", "#c0392b"),
  border = "gray30"
)
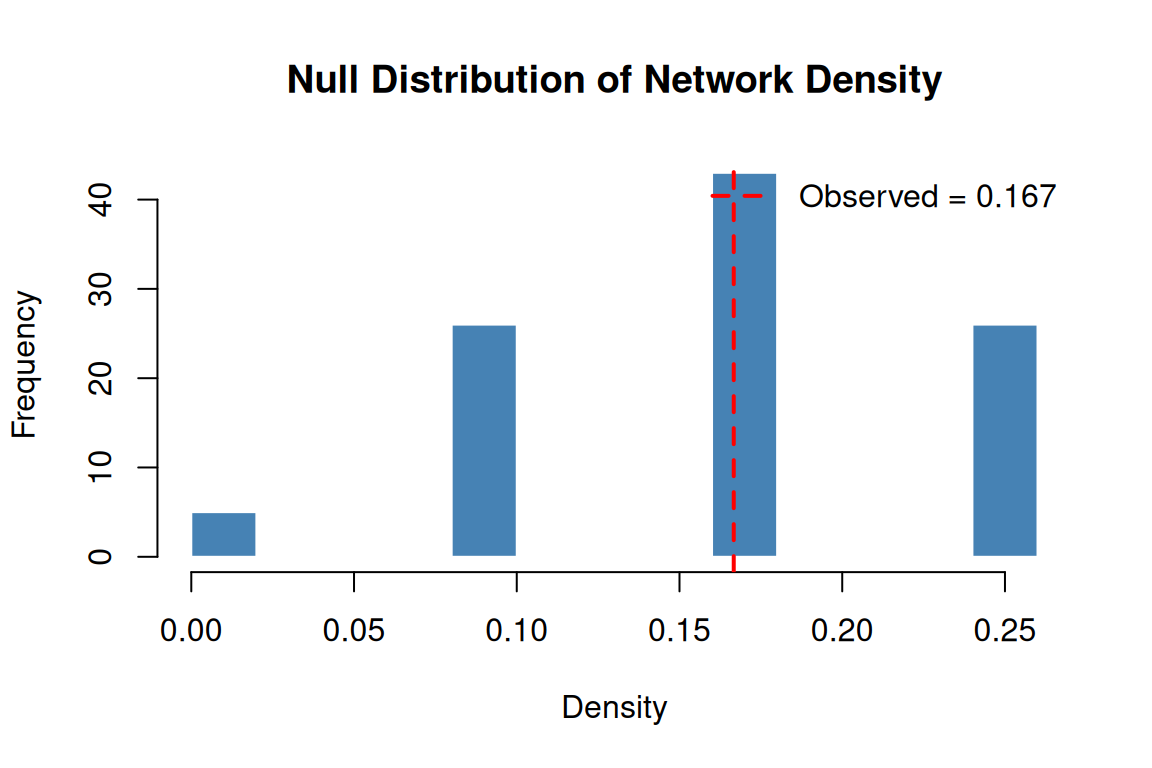
Null Model Testing
Using the individual accuracy rates, sample_css_network() generates synthetic CSS data that preserves each perceiver’s overall error rates but randomises which dyads are misperceived. Repeating this many times yields a null distribution for any network statistic.
set.seed(123)
n_samples <- 100

null_densities <- replicate(n_samples, {
  nets <- sample_css_network(graph, keep_baseline = FALSE)
  sum(nets[[1]]) / (4 * 3)
})

sampled <- sample_css_network(graph, keep_baseline = TRUE)
observed_density <- sum(sampled[[2]]) / (4 * 3)

hist(
  null_densities,
  breaks = 15,
  col = "steelblue",
  border = "white",
  main = "Null Distribution of Network Density",
  xlab = "Density"
)
abline(v = observed_density, col = "red", lwd = 2, lty = 2)
legend("topright",
  legend = paste("Observed =", round(observed_density, 3)),
  col = "red", lty = 2, lwd = 2, bty = "n"
)
Key Takeaways
- Reciprocity errors quantify how people misperceive mutual relationships.
- The imaginary census provides a fine-grained, 10-category taxonomy of perceptual errors.
- Individual accuracy rates separate ego-involved from alter-only dyads and true positives from true negatives.
- Null models based on these rates let us test whether observed motif counts are more extreme than expected by chance.